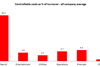
Payroll costs for licensed retailers increased from 24.2% of turnover in 2013 to 26.4% last year, according to the latest benchmarking report from the Association of Licensed Multiple Retailers.

The results come as the industry digests the implications of the National Living Wage, which will come into force from April at an initial rate of £7.20 an hour.

Payroll costs have increased from 17% of turnover since the ALMR first started monitoring them in 1999. While overall payroll costs rose between the 2014 and 2015 reports, the average manager’s salary remained steady at 6.5% of turnover.

The report also shows another rise in the cost to licensed hospitality of increased legislation, particularly in the late night sector through more levies and rising licensing fees.

The average rise in like-for-like sales across the companies surveyed was 4.2% for the year ending September 2014, compared to 4.8% for the year before. Average gross margins were 66% on wet sales and 64% on dry.

Key points

Overall, the report shows a picture of a consolidated recovery – with evidence last year of capex and employment back on track and costs under control, continuing. The figures also show a levelling up with less variation across outlets and within market segments.

The report shows the average cost of running a licensed hospitality venue – excluding rent and cost of sales - was 47.7% of annual turnover, down slightly from 47.8% the year before. The five-year average is 47.3% of turnover, but operating costs have risen by 3% over the period. Operating costs were slightly higher in freehold premises, at 48.7% of turnover, than in leasehold, at 47.1%.

Entertainment and utility costs were both down, with the former now representing just 4.9% of turnover (down 1.3 percentage points year-on-year). The ALMR said this in part reflected the higher proportion of food led/casual dining restaurants included in the report but also represented a switch off in response to cost increases. Utility costs fell to 3.4% of turnover, the lowest in nine surveys.

Rent is, on average, equivalent to 9.3% of turnover in leasehold estates, down from 10.5% last year. Rents in majority tied leasehold estates are very similar to those in majority untied.

Average capital expenditure was 3.7% of turnover, up from 2.9% last year. Capex was highest in casual dining outlets, while high street outlets were again above average.

On average, wet sales accounted for 63% of turnover - down 14% year on year and the lowest recorded in nine surveys. Food sales hit 30%, the highest recorded. Accommodation accounted for 3% and gaming 1% - broadly unchanged over recent years.

Like-for-like sales

The report breaks down like-for-like turnover changes by both estate size and market segmentation.

For the sixth consecutive survey, respondents with fewer than 10 outlets tended to report larger rises in like-for-like turnover, up 5.6% this year, with mid-sized companies (10-30 outlets) up 5.9% but those with 30+ sites down 0.3%.

Accommodation providers recorded the highest like-for-like rise at an average of 6% with food-led and community locals both up 5.5%. High street outlets performed below the cohort average with a 3.9% rise, as did casual dining at 2.2%, wine bars at 0.7% and clubs at -3%.

Over the six years to September 2014, the turnover of a typical food outlet would have increased by around 52%, compared with 29% for a high street outlet and 40% for a community local outlet.

Ownership model

On average, controllable costs were higher in the freehold sector than in the leasehold sector. The average cost of running a freehold outlet was 48.7% of turnover, compared with 47.2% for leasehold/tenanted properties and 47.7% for the survey as a whole.

The report shows recorded rents in majority tied estates very similar to those in majority untied estates for the second year in a row (9.2% of turnover and 9.3% respectively). That follows two years in which rents in majority tied estates were significantly higher.

At the same time, gross margins were again substantially higher in estates where a majority of premises are not tied. The ALMR puts this down largely to a reflection of different trading styles, with tied outlets being more wet led and commercial leases being more food led. The report shows majority tied estates recording gross wet margins of 62.3% and dry 62.1% with majority not tied recording 67% and 63.9% respectively.

Sky/BT

Sky/BT accounted for 0.6% of costs on average, rising to 1.5% in community local outlets - a slight drop in last year’s figures despite cost increases having been passed through by broadcasters. The ALMR believes this may reflect price elasticities as well as the changing nature of the licensed hospitality market.

Methodology

The ALMR Benchmarking Report is based on a survey of operators with 44 submissions, covering 3,707 outlets. The majority were pubs – community local (34%) and high street (22%) – or food-led outlets, both pubs and casual dining restaurants. The latter were included in the survey for the first time this year.