- News
- Finance
- Opinion
- Analysis & Insight
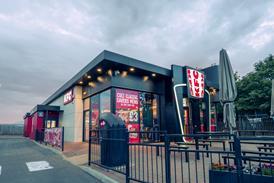 KFC’s evolution is a ‘direct challenge’ to Wingstop’s core equity
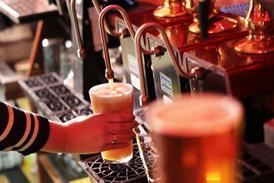 Hospitality remains ‘stuck in stagnation’ as like-for-like sales grow marginally in May
 ‘This is not the end of the traditional night out’: How consumers are socialising around wellness
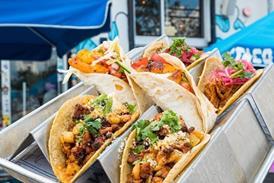 London enjoying ‘taco renaissance’ as online searches surge
- Interviews
- Innovation
- People
- Events
- Subscribe now

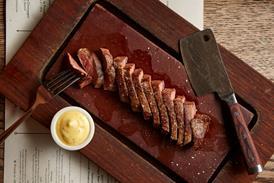


Family Food Survey shows sharp fall in drinking out
The average amount of alcohol drunk while eating out has fallen 54% since 2002, according to the latest Family Food Report.
Already have an account? Sign in